Results of Operations, Financial Position and Net Assets
The Volkswagen Group’s operating result was down considerably year-on-year in 2015 due to charges in connection with the emissions issue, and restructuring measures in the trucks business and in the passenger cars area in South America. Sales revenue increased.
The Volkswagen Group’s segment reporting in compliance with IFRS 8 comprises the four reportable segments Passenger Cars, Commercial Vehicles, Power Engineering and Financial Services, in line with the Group’s internal management and reporting.
At Volkswagen, segment profit or loss is measured on the basis of the operating result.
| (XLS:) |
KEY FIGURES FOR 2015 BY SEGMENT |
|
|
||||||||||||
|---|---|---|---|---|---|---|---|---|---|---|---|---|---|---|
€ million |
Passenger Cars |
Commercial Vehicles |
Power Engineering |
Financial Services |
Total segments |
Reconciliation |
Volkswagen Group |
|||||||
|
|
|
|
|
|
|
|
|||||||
Sales revenue |
174,703 |
30,445 |
3,775 |
29,357 |
238,279 |
−24,987 |
213,292 |
|||||||
Segment profit or loss (operating result) |
−4,874 |
586 |
123 |
2,236 |
−1,929 |
−2,139 |
−4,069 |
|||||||
as a percentage of sales revenue |
−2.8 |
1.9 |
3.2 |
7.6 |
|
|
−1.9 |
|||||||
Capex, including capitalized development costs |
15,085 |
2,426 |
198 |
476 |
18,185 |
50 |
18,234 |
|||||||
The reconciliation column contains activities and other operations that do not by definition constitute segments. These include the unallocated Group financing activities. Consolidation adjustments between the segments (including the holding company functions) are also contained in the reconciliation. Purchase price allocation for Porsche Holding Salzburg and Porsche, as well as for Scania and MAN, reflects their accounting treatment in the segments.
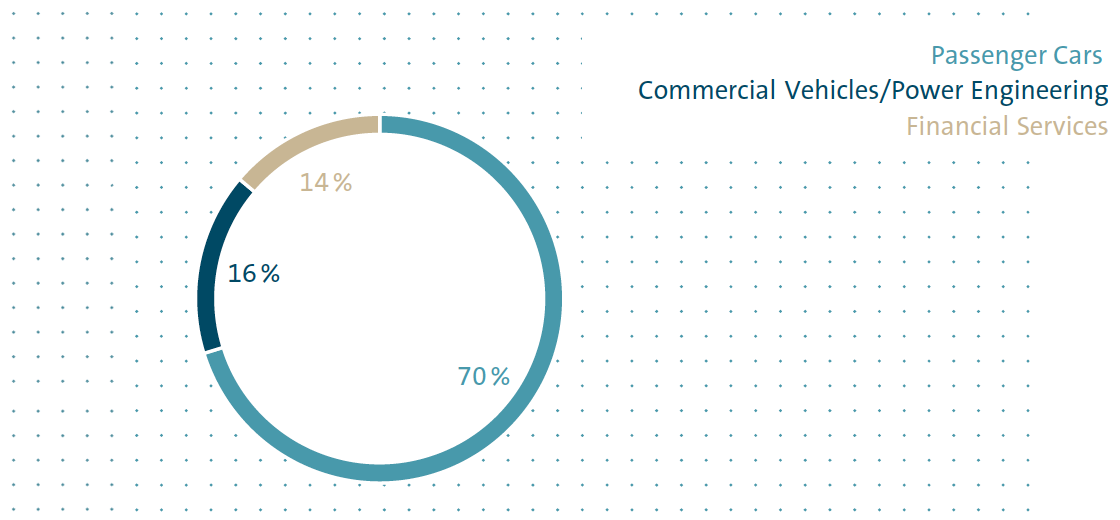
The Automotive Division comprises the Passenger Cars, Commercial Vehicles and Power Engineering segments, as well as the figures from the reconciliation. The Passenger Cars segment and the reconciliation are combined to form the Passenger Cars Business Area. We report on the Commercial Vehicles and Power Engineering segments under the Commercial Vehicles/Power Engineering Business Area. The Financial Services Division corresponds to the Financial Services segment.
Activities in the Passenger Cars segment cover the development of vehicles and engines, the production and sale of passenger cars, and the genuine parts business. This segment combines the Volkswagen Group’s individual passenger car brands on a consolidated basis. It also includes the Ducati brand’s motorcycle business.
The Commercial Vehicles segment primarily comprises the development, production and sale of light commercial vehicles, trucks and buses from the Volkswagen Commercial Vehicles, Scania and MAN brands, the corresponding genuine parts business and related services.
The Power Engineering segment combines the large-bore diesel engines, turbomachinery, special gear units, propulsion components and testing systems businesses.
The activities of the Financial Services segment comprise dealer and customer financing, leasing, banking and insurance activities, fleet management and mobility offerings.
SPECIAL ITEMS IN THE FISCAL YEAR
On September 18, 2015, US authorities publicly announced that irregularities had been discovered in the software used for certain Volkswagen Group diesel engines. In a statement issued on September 22, 2015, the Volkswagen Group announced that there are irregularities in around 11 million vehicles worldwide with type EA 189 diesel engines. In fiscal year 2015, this resulted in exceptional charges, in particular for the technical measures planned for the diesel engines affected, repurchases, customer-related measures and legal risks. The negative special items relating to the diesel issue amounted to €16.2 billion and were recognized in the operating result.
The operating result was also impacted by special items relating to restructuring expenses in the trucks business (€0.2 billion) and in the passenger cars area in South America (€0.2 billion). The restructuring measures serve to sustainably enhance competitiveness.
Additionally, the competent authorities directed all automobile manufacturers affected to replace potentially faulty airbags manufactured and supplied by Takata, resulting in a requirement to recognize provisions. The recall and replacement of the airbags is limited to the USA and Canada. 0.9 million Volkswagen Group vehicles are affected. The special items recognized in the operating result relating to these measures amount to €−0.3 billion.
Overall, negative special items recognized in the operating result therefore amounted to €16.9 billion in fiscal year 2015.
SALE OF SUZUKI SHARES
In August 2015, the arbitration ruling in the proceedings between Suzuki Motor Corporation and Volkswagen AG was delivered to the parties. Volkswagen subsequently sold its 19.9% equity investment in Suzuki to Suzuki on September 17, 2015 at the quoted market price of €3.1 billion. The sale of the shares generated income in the amount of €1.5 billion, which was recognized in the other financial result.
SETTLEMENT PAYMENT TO NONCONTROLLING INTEREST SHAREHOLDERS OF MAN SE
In the award proceedings regarding the appropriateness of the cash settlement to be paid to the noncontrolling interest shareholders of MAN SE, the Munich Regional Court ruled in the first instance at the end of July 2015 that the settlement payment to be made to the shareholders should be increased from €80.89 to €90.29 per share. Both Volkswagen and a number of noncontrolling interest shareholders have appealed to the Higher Regional Court in Munich. Remeasurement of the put options and compensation rights resulted in an expense of €0.4 billion, which was recognized in the other financial result.
Results of operations of the Group
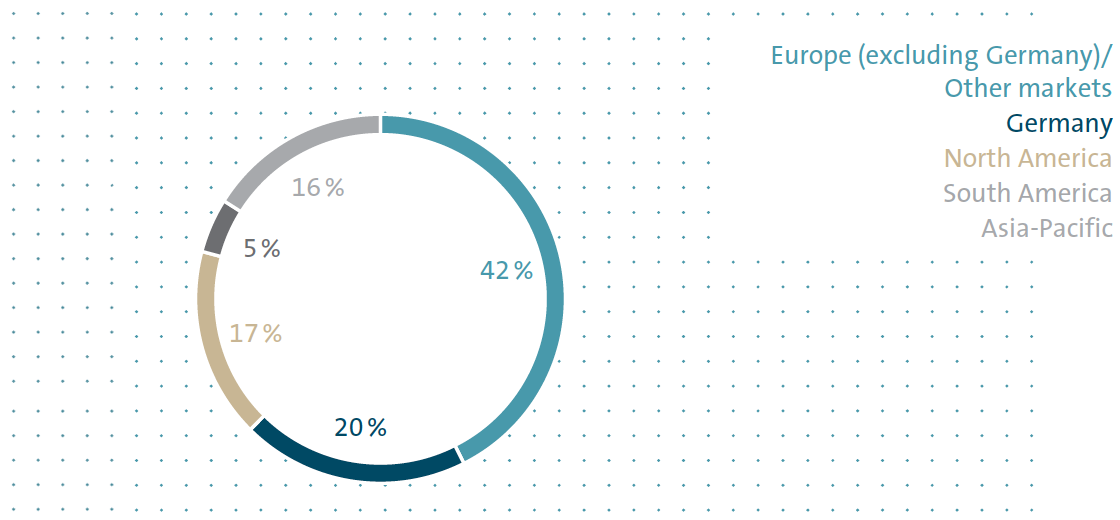
The Volkswagen Group generated sales revenue of €213.3 billion in fiscal year 2015, 5.4% higher than in the previous year. The increase was mainly attributable to improvements in the mix, positive exchange rate effects and the positive business development in the Financial Services Division. The Group generated 80.2 (80.6)% of its sales revenue outside Germany.
At €33.9 (36.5) billion, gross profit was below the level of the previous year. The cost of sales rose by 8.1%, primarily as a result of the charges in connection with the diesel issue. In addition, higher depreciation and amortization charges as a result of the high volume of capital expenditures and higher upfront expenditures – especially for new drive concepts – had a negative effect, while optimized product costs had a positive effect. The gross margin was 15.9 (18.0)%; excluding special items it was 19.9%.
Distribution expenses rose by 15.9% in the year under review due to the diesel issue and exchange rate changes; the ratio of distribution expenses to sales revenue also increased. Administrative expenses were up 5.2% on the previous year, although the ratio of administrative expenses to sales revenue remained unchanged. The other operating result declined by €10.6 billion to €−7.3 billion, mainly as a result of negative exchange rate effects, legal risks in connection with the emissions issue and restructuring measures in the trucks business and in the passenger cars business area in South America.
Excluding the special items, the Volkswagen Group’s operating result in fiscal year 2015 was on a level with the previous year, at €12.8 billion. Lower vehicle volumes, higher depreciation and amortization charges, and higher research and development expenditures were offset in part by optimized product costs, improvements in the mix and more favorable exchange rates. The operating return on sales before special items was 6.0 (6.3)%.
Negative special items totaled €16.9 billion. As a result, the operating result declined sharply to €−4.1 (12.7) billion; the operating return on sales decreased to −1.9 (6.3%).
The Volkswagen Group’s earnings before tax amounted to €−1.3 billion in fiscal year 2015, €16.1 billion lower than in the previous year. The return on sales before tax fell from 7.3% to −0.6%. The income tax expense amounted to €0.1 (3.7) billion. Earnings after tax were down €12.4 billion on the prior-year figure, at €−1.4 billion.
| (XLS:) |
INCOME STATEMENT BY DIVISION |
|
|
||||||||||||
|---|---|---|---|---|---|---|---|---|---|---|---|---|---|---|
|
VOLKSWAGEN GROUP |
AUTOMOTIVE* |
FINANCIAL SERVICES |
|||||||||||
€ million |
2015 |
2014 |
2015 |
2014 |
2015 |
2014 |
||||||||
|
|
|
|
|
|
|
||||||||
|
||||||||||||||
Sales revenue |
213,292 |
202,458 |
183,936 |
177,538 |
29,357 |
24,920 |
||||||||
Cost of sales |
−179,382 |
−165,934 |
−155,553 |
−146,311 |
−23,829 |
−19,623 |
||||||||
Gross profit |
33,911 |
36,524 |
28,382 |
31,226 |
5,528 |
5,297 |
||||||||
Distribution expenses |
−23,515 |
−20,292 |
−22,281 |
−19,199 |
−1,234 |
−1,093 |
||||||||
Administrative expenses |
−7,197 |
−6,841 |
−5,646 |
−5,427 |
−1,552 |
−1,414 |
||||||||
Net other operating result |
−7,267 |
3,306 |
−6,761 |
4,180 |
−506 |
−874 |
||||||||
Operating result |
−4,069 |
12,697 |
−6,305 |
10,780 |
2,236 |
1,917 |
||||||||
Operating return on sales (%) |
−1.9 |
6.3 |
−3.4 |
6.1 |
7.6 |
7.7 |
||||||||
Share of profits and losses of equity-accounted investments |
4,387 |
3,988 |
4,366 |
3,956 |
21 |
31 |
||||||||
Other financial result |
−1,620 |
−1,891 |
−1,695 |
−1,907 |
75 |
17 |
||||||||
Financial result |
2,767 |
2,097 |
2,671 |
2,049 |
97 |
48 |
||||||||
Earnings before tax |
−1,301 |
14,794 |
−3,634 |
12,829 |
2,333 |
1,965 |
||||||||
Income tax expense |
−59 |
−3,726 |
527 |
−3,097 |
−586 |
−629 |
||||||||
Earnings after tax |
−1,361 |
11,068 |
−3,107 |
9,732 |
1,747 |
1,336 |
||||||||
Noncontrolling interests |
10 |
84 |
−10 |
43 |
19 |
41 |
||||||||
Earnings attributable to Volkswagen AG hybrid capital investors |
212 |
138 |
212 |
138 |
– |
– |
||||||||
Earnings attributable to Volkswagen AG shareholders |
−1,582 |
10,847 |
−3,310 |
9,551 |
1,728 |
1,295 |
||||||||
SHARE OF SALES REVENUE BY MARKET 2015
in percent
SHARE OF SALES REVENUE BY DIVISION/BUSINESS AREA 2015
in percent
Results of operations in the Automotive Division
The Automotive Division’s sales revenue rose year-on-year to €183.9 (177.5) billion in the reporting period. The increase was primarily due to positive mix effects and the exchange rate trend, which was partly offset by a decline in vehicle unit sales. As our Chinese joint ventures are accounted for using the equity method, the Group’s business growth in the Chinese passenger car market is mainly reflected in consolidated sales revenue only by deliveries of vehicles and vehicle parts.
Cost of sales was negatively impacted by increased depreciation charges as a result of high capital expenditures, increased research and development expenditures – particularly for new drive concepts – and exchange rate effects. Other items recognized here comprised the charges for technical measures and repurchases in connection with the diesel issue. Improved product costs had a positive effect. The ratio of cost of sales to sales revenue rose year-on-year. At €28.4 (31.2) billion, gross profit in the Automotive Division was below the previous year.
Distribution expenses in the reporting period were 16.1% higher than in the previous year as a result of the emissions issue and exchange rate effects. The ratio of distribution expenses to sales revenue also increased. Administrative expenses rose by 4.0% due among other things to exchange rate effects, although the ratio of administrative expenses to sales revenue remained unchanged. The other operating result declined by €10.9 billion to €−6.8 billion. The change is largely attributable to negative exchange rate effects, the special items resulting from legal risks in connection with the diesel issue and the restructuring expenses in the trucks business and in the passenger cars business area in South America.
The Automotive Division generated an operating result of €−6.3 billion in fiscal year 2015, down €17.1 billion on the previous year due in particular to the special items. The operating return on sales fell to −3.4 (6.1)%. The operating result before special items was €10.6 (10.8) billion. Declining vehicle volumes, higher depreciation and amortization charges as a result of the high volume of capital expenditures, higher upfront expenditures – especially for new drive concepts – and market support measures linked to the emissions issue weighed on the operating result. It was positively impacted by optimized product costs, improvements in the mix and more favorable exchange rates. Since the profit recorded by the joint venture companies is accounted for in the financial result using the equity method, the business growth of our Chinese joint ventures is mainly reflected in the Group’s operating result only by deliveries of vehicles and vehicle parts as well as license revenue.
The financial result improved by €0.6 billion to €2.7 billion. The increase was due to the disposal gain on the shares in Suzuki, income from the Chinese joint ventures, which was up on the prior-year figures, as a result of exchange rate effects as well as lower overall finance costs. Higher expenses from the measurement of derivative financial instruments at the reporting date and negative remeasurement effects relating to the put options and compensation rights in the context of the control and profit and loss transfer agreement with MAN SE had an offsetting effect.
| (XLS:) |
RESULTS OF OPERATIONS IN THE PASSENGER CARS BUSINESS AREA |
||||
|---|---|---|---|---|
€ million |
2015 |
2014 |
||
|
|
|
||
Sales revenue |
149,716 |
143,601 |
||
Gross profit |
23,023 |
26,153 |
||
Operating result |
−7,013 |
9,835 |
||
Operating return on sales (%) |
−4.7 |
6.8 |
||
The Passenger Cars Business Area recorded sales revenue of €149.7 billion in fiscal year 2015, up 4.3% on the 2014 figure. Gross profit declined to €23.0 (26.2) billion. The operating result fell by €16.8 billion to €−7.0 billion; the operating return on sales decreased to −4.7 (6.8)%. The special items and the declining vehicle unit sales, higher depreciation and amortization charges as a result of the high volume of capital expenditures and increased research and development costs had a negative impact. Optimized product costs, improvements in the mix and more favorable exchange rates were unable to compensate for these effects.
| (XLS:) |
RESULTS OF OPERATIONS IN THE COMMERCIAL VEHICLES/ POWER ENGINEERING BUSINESS AREA |
||||
|---|---|---|---|---|
€ million |
2015 |
2014 |
||
|
|
|
||
Sales revenue |
34,220 |
33,937 |
||
Gross profit |
5,359 |
5,074 |
||
Operating result |
709 |
945 |
||
Operating return on sales (%) |
2.1 |
2.8 |
||
The Commercial Vehicles/Power Engineering Business Area generated sales revenue of €34.2 (33.9) billion in fiscal year 2015, of which €3.8 (3.7) billion was attributable to the Power Engineering segment. Gross profit rose by 5.6% to €5.4 billion. The operating result decreased to €0.7 (0.9) billion, while the operating return on sales declined from 2.8% to 2.1%. The reasons for this decline were the difficult environment in Brazil and Russia, together with the related decrease in volumes, as well as the restructuring measures in the trucks business, which could not be offset by positive exchange rate effects and the expansion of the service business. At €123 (44) million, the operating result in the Power Engineering segment exceeded the prior-year figure.
Results of operations in the Financial Services Division
The Financial Services Division generated sales revenue of €29.4 billion in fiscal year 2015. The 17.8% year-on-year increase was attributable to higher business volumes and positive exchange rate effects.
At €5.5 billion, gross profit was 4.4% higher than in the previous year despite sustained pressure on margins and higher depreciation and amortization charges.
Because of the higher volumes and in particular the need to comply with continued increase in regulatory requirements, distribution and administrative expenses increased in the year under review, although the ratios of both to sales revenue declined slightly. Other operating result amounted to €−0.5 (−0.9) billion.
The operating result at the Financial Services Division rose by 16.6% year-on-year to €2.2 billion, again making a significant contribution to the Group’s result. The operating return on sales declined to 7.6 (7.7)%. At 12.2 (12.5)%, the return on equity was down on the prior-year figure.