Net Assets
Consolidated balance sheet structure
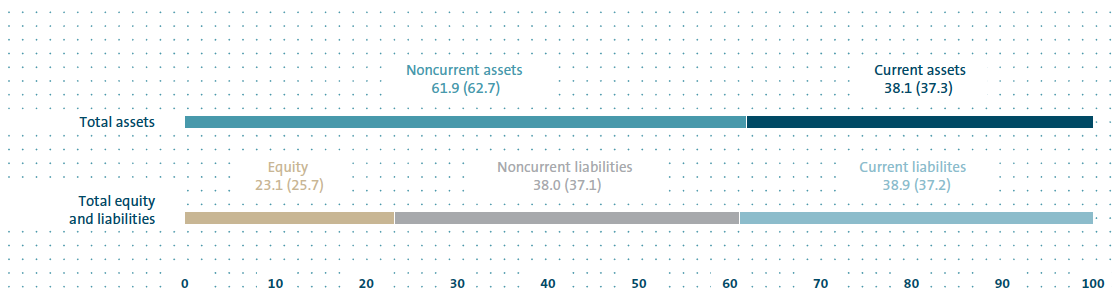
At €381.9 billion, the Volkswagen Group’s total assets as of December 31, 2015 exceeded the prior-year figure by 8.7%, due among other things to the increased business volume of the Financial Services Division and to currency factors. The structure of the consolidated balance sheet as of the reporting date can be seen from the chart on this page. The Volkswagen Group’s equity amounted to €88.3 (90.2) billion at the end of fiscal year 2015. The equity ratio decreased to 23.1 (25.7)%.
As of December 31, 2015, the Group had off-balance-sheet commitments in the form of contingent liabilities in the amount of €3.5 (3.1) billion, financial guarantees in the amount of €1.6 (1.4) billion and other financial obligations in the amount of €25.4 (27.3) billion. The latter primarily result from purchase commitments for property, plant and equipment, as well as obligations under long-term leasing and rental contracts and irrevocable credit commitments to customers. Furthermore, negotiations regarding the diesel issue are currently being conducted with the authorities in the USA concerning possible investments in environmental projects and e-mobility. The investments are expected to amount to approximately €1.8 billion. Their content and timing have yet to be defined.
CONSOLIDATED BALANCE SHEET STRUCTURE 2015
in percent
Automotive Division balance sheet structure
The Automotive Division’s intangible assets and in particular its property, plant and equipment, which reflect the high volume of capital expenditures, were up on the year-end 2014 figures as of December 31, 2015. While equity-accounted investments rose mainly as a result of the acquisition of the shares in HERE, a technology provider for maps and location services, other equity investments declined due to the sale of the shares in Suzuki. Noncurrent assets rose by a total of 3.6%.
Overall, current assets increased by 7.0% year-on-year; within this item, inventories rose by 11.0% due to production-related and exchange rate factors. Marketable securities amounted to €12.3 (9.2) billion and cash and cash equivalents declined by €0.8 billion to €15.7 billion.
The Automotive Division’s equity amounted to €67.4 billion at the end of 2015, down 7.5% on the December 31, 2014 figure. It was positively affected by healthy earnings growth before special items, the hybrid notes issued in March and lower actuarial losses from the measurement of pension provisions. Charges resulting from the special items, amounts recognized in other comprehensive income due to the measurement of derivatives and the dividend payment to Volkswagen AG shareholders had an offsetting effect. The capital increases implemented in the Financial Services Division also reduced equity in the Automotive Division, where the deduction was recognized. The noncontrolling interests are mainly attributable to RENK AG and AUDI AG. Since these were lower overall than the noncontrolling interests attributable to the Financial Services Division, the figure for the Automotive Division, where the deduction was recognized, was negative. The division’s equity ratio decreased to 32.6 (36.9)%.
Noncurrent liabilities increased year-on-year to €73.6 (66.4) billion. Within this item, other liabilities were higher due to negative effects from the measurement of derivatives, while other provisions rose as a result of the special items. In contrast, pension provisions decreased following the change in the discount rate.
Current liabilities totaled €65.9 billion, up 13.3% on the year-end 2014 figure. Other liabilities increased due to the measurement of derivatives, and other provisions rose as a result of the special items. Reclassifications from noncurrent to current liabilities, in particular due to shorter remaining maturities, led to an increase in current financial liabilities. The figures for the Automotive Division also contain the elimination of intragroup transactions between the Automotive and Financial Services divisions. As the current financial liabilities for the primary Automotive Division were lower than the loans granted to the Financial Services division, a negative amount was disclosed for the reporting period. The item “Put options and compensation rights granted to noncontrolling interest shareholders” primarily comprises the liability for the obligation to acquire the shares held by the remaining free float shareholders of MAN. The item was adjusted to €3.9 (3.7) billion, mainly due to the increase in the cash settlement payment from the first instance of the award proceedings.
The Automotive Division’s total assets amounted to €206.8 billion as of December 31, 2015, up 4.8% on the year-end 2014 figure.
| (XLS:) |
PASSENGER CARS BUSINESS AREA BALANCE SHEET STRUCTURE |
||||
|---|---|---|---|---|
€ million |
2015 |
2014 |
||
|
|
|
||
Noncurrent assets |
105,028 |
101,459 |
||
Current assets |
57,289 |
52,869 |
||
Total assets |
162,317 |
154,328 |
||
Equity |
54,598 |
58,708 |
||
Noncurrent liabilities |
61,195 |
54,366 |
||
Current liabilities |
46,524 |
41,254 |
||
At year-end 2015, noncurrent assets in the Passenger Cars Business Area were up 3.5% on the prior-year figure at €105.0 billion. Property, plant and equipment increased as a result of the comprehensive investment program, and equity-accounted investments rose primarily because of the acquisition of the shares in HERE. Current assets rose by 8.4% to €57.3 billion, mainly due to the increase in inventories and marketable securities. Total assets amounted to €162.3 (154.3) billion as of December 31, 2015.
Equity declined by €4.1 billion to €54.6 billion, despite the healthy earnings performance before special items. Noncurrent liabilities increased by 12.6%, while current liabilities rose by 12.8% – this figure includes reclassifications resulting from shorter maturities. Both noncurrent and current provisions increased because of the special items, especially those relating to the diesel issue.
| (XLS:) |
COMMERCIAL VEHICLES/POWER ENGINEERING BUSINESS AREA BALANCE SHEET STRUCTURE |
||||
|---|---|---|---|---|
€ million |
2015 |
2014 |
||
|
|
|
||
Noncurrent assets |
27,784 |
26,772 |
||
Current assets |
16,730 |
16,311 |
||
Total assets |
44,515 |
43,083 |
||
Equity |
12,767 |
14,107 |
||
Noncurrent liabilities |
12,373 |
12,072 |
||
Current liabilities |
19,374 |
16,904 |
||
In the Commercial Vehicles/Power Engineering Business Area, both noncurrent and current assets were up year-on-year at the end of the reporting period. Total assets rose to €44.5 (43.1) billion.
At €12.8 billion, equity was down 9.5% on the previous year. Noncurrent liabilities increased by 2.5% and current liabilities by 14.6% compared with the 2014 reporting date.
Financial Services Division balance sheet structure
The Financial Services Division’s total assets amounted to €175.1 billion on December 31, 2015, 13.9% higher than at the 2014 year-end.
The increase in lease assets and noncurrent financial services receivables due to the positive business performance and exchange rate effects saw noncurrent assets rise by 12.9% overall. Current assets were up 15.3% on the prior-year figure, also as a result of volume-related factors and exchange rate effects. Within this item, current financial services receivables increased by €2.6 billion to €47.5 billion, while cash and cash equivalents rose by €2.6 billion to €5.2 billion. The Financial Services Division accounted for approximately 45.8% of the Volkswagen Group’s assets at the reporting date.
At €20.9 billion, the Financial Services Division’s equity as of December 31, 2015 exceeded the prior-year figure by 20.3%. In addition to earnings growth, equity was pushed up by capital increases implemented by Volkswagen AG to finance the growth in business and meet regulatory capital requirements. The equity ratio was 11.9 (11.3)%. Noncurrent liabilities rose by 12.1% and current liabilities increased by 13.8% as against year-end 2014. In both cases, this was attributable to the funding of volume growth and exchange rate effects. At €26.5 (25.3) billion, deposits from direct banking business were higher than in the previous year. The debt to equity ratio amounted to 7:1.
| (XLS:) |
CONSOLIDATED BALANCE SHEET BY DIVISION AS OF DECEMBER 31 |
||||||||||||||
|---|---|---|---|---|---|---|---|---|---|---|---|---|---|---|
|
VOLKSWAGEN GROUP |
AUTOMOTIVE1 |
FINANCIAL SERVICES |
|||||||||||
€ million |
2015 |
2014 |
2015 |
2014 |
2015 |
2014 |
||||||||
|
|
|
|
|
|
|
||||||||
|
||||||||||||||
Assets |
|
|
|
|
|
|
||||||||
Noncurrent assets |
236,548 |
220,106 |
132,812 |
128,231 |
103,736 |
91,875 |
||||||||
Intangible assets |
61,147 |
59,935 |
60,918 |
59,697 |
228 |
237 |
||||||||
Property, plant and equipment |
50,171 |
46,169 |
47,768 |
44,080 |
2,403 |
2,089 |
||||||||
Lease assets |
33,173 |
27,585 |
2,931 |
2,815 |
30,242 |
24,770 |
||||||||
Financial services receivables |
63,185 |
57,877 |
– |
– |
63,185 |
57,877 |
||||||||
Investments, equity-accounted investments and other equity investments, other receivables and financial assets |
28,873 |
28,541 |
21,195 |
21,639 |
7,678 |
6,902 |
||||||||
Current assets |
145,387 |
131,102 |
74,019 |
69,180 |
71,367 |
61,923 |
||||||||
Inventories |
35,048 |
31,466 |
31,369 |
28,269 |
3,679 |
3,197 |
||||||||
Financial services receivables |
46,888 |
44,398 |
−614 |
−464 |
47,502 |
44,862 |
||||||||
Other receivables and financial assets |
27,572 |
25,254 |
15,315 |
15,677 |
12,257 |
9,577 |
||||||||
Marketable securities |
15,007 |
10,861 |
12,261 |
9,197 |
2,747 |
1,664 |
||||||||
Cash, cash equivalents and time deposits |
20,871 |
19,123 |
15,688 |
16,499 |
5,183 |
2,624 |
||||||||
Total assets |
381,935 |
351,209 |
206,831 |
197,411 |
175,103 |
153,798 |
||||||||
|
|
|
|
|
|
|
||||||||
Equity and liabilities |
|
|
|
|
|
|
||||||||
Equity |
88,270 |
90,189 |
67,366 |
72,815 |
20,905 |
17,374 |
||||||||
Equity attributable to Volkswagen AG shareholders |
80,500 |
84,950 |
59,898 |
67,828 |
20,603 |
17,122 |
||||||||
Equity attributable to Volkswagen AG hybrid capital investors |
7,560 |
5,041 |
7,560 |
5,041 |
– |
– |
||||||||
Equity attributable to Volkswagen AG shareholders and hybrid capital investors |
88,060 |
89,991 |
67,458 |
72,870 |
20,603 |
17,122 |
||||||||
Noncontrolling interests |
210 |
198 |
−92 |
−55 |
302 |
253 |
||||||||
Noncurrent liabilities |
145,175 |
130,314 |
73,568 |
66,438 |
71,607 |
63,876 |
||||||||
Financial liabilities |
73,292 |
68,416 |
9,557 |
10,643 |
63,735 |
57,773 |
||||||||
Provisions for pensions |
27,535 |
29,806 |
27,119 |
29,361 |
415 |
445 |
||||||||
Other liabilities |
44,349 |
32,092 |
36,892 |
26,434 |
7,457 |
5,658 |
||||||||
Current liabilities |
148,489 |
130,706 |
65,898 |
58,158 |
82,591 |
72,547 |
||||||||
Put options and compensation rights granted to noncontrolling interest shareholders |
3,933 |
3,703 |
3,933 |
3,703 |
– |
– |
||||||||
Financial liabilities |
72,313 |
65,564 |
−3,974 |
−847 |
76,286 |
66,411 |
||||||||
Trade payables |
20,460 |
19,530 |
18,709 |
17,838 |
1,751 |
1,692 |
||||||||
Other liabilities |
51,783 |
41,909 |
47,229 |
37,465 |
4,554 |
4,444 |
||||||||
Total equity and liabilities |
381,935 |
351,209 |
206,831 |
197,411 |
175,103 |
153,798 |
||||||||